

Cadence Tools Support Hotline
(+60) 1111 247 265

Upgrade to OrCAD ® X EE(PSpice ®) Designer Plus can provide advanced PSpice analysis simulation, which, together with PSpice core simulation, can maximize design performance, reduce costs, and improve reliability. These advanced simulations include sensitivity analysis, Monte Carlo analysis, electrical stress analysis, optimization analysis, and parameter drawing analysis, which help users deal with problems caused by changes in electronic component manufacturing parameters. They can enable users to have a deeper understanding of circuit performance, which may deviate from the basic design in the case of changes in component parameters.
 Product Details
Product Highlights
• Electrical stress analysis can identify which components exceed the actual safe working range, while Monte Carlo analysis can discover the impact of device deviations on circuits, thereby eliminating on-site faults.
•By conducting sensitivity analysis, identify which components have the most critical impact on performance, and then increase the accuracy requirements for sensitive components while reducing the accuracy requirements for non sensitive components, in order to optimize costs.
•By optimizing analysis, find the optimal component values that can meet design performance indicators and constraints, helping users to quickly fine tune designs
•By statistically analyzing the behavior of simulated circuits and considering the variation of component values within their error range, we can deeply explore the working conditions of the circuit.
Simulation characteristics
PSpice advanced analysis simulation is used to improve design performance, enhance frequency and reliability, etc. Temperature and electrical stress analysis, worst-case analysis, Monte Carlo analysis, automatic optimization algorithms, etc. can all help improve design quality and maximize circuit performance.
sensitivity analysis
Sensitivity analysis can identify which device parameter has the most critical impact on circuit performance indicators, by asking similar questions such as "Does R1 have a greater impact on bandwidth than R2? ”It can check how inherent manufacturing deviations of components affect circuit behavior and compare it with other components. It can also simulate the worst-case scenario (minimum and maximum values) within the error range of components. Sensitivity analysis can also identify which device has the greatest impact on yield, allowing users to choose higher precision for sensitive components. This analysis can evaluate the balance between yield and root cause.
Optimization analysis
Optimization tools are used to analyze analog circuits and systems, and to quickly identify the optimal component values that meet performance indicators and constraints by fine-tuning design parameters. Circuit indicators can be simple maximum output voltage values, or more complex calculation results, such as the cutoff frequency of a low-pass filter, or using the curve fitting function of optimization tools to optimize the entire curve.
Electrical stress analysis
Electrical stress analysis will trigger alarms for junction temperature rise, secondary breakdown, or voltage and current exceeding limits caused by device power consumption. After a period of time, these overstressed devices will lead to design failure. Electrical stress analysis compares the simulation results of the device with the safe operating range limit of the device. Once the limit is exceeded, the electrical stress analysis will indicate the problematic parameters.
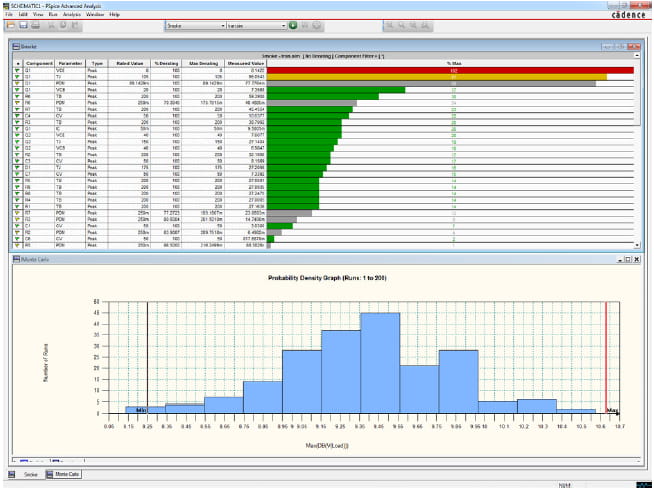
Monte Carlo analysis
Monte Carlo analysis uses circuit statistical methods to predict circuit behavior, that is, the id circuit behavior when multiple devices vary within an error range. By randomly changing the values of all components within the error range, users can approximately evaluate the yield of mass-produced products. These measurement results can help users determine how much proportion of products will exceed the design specifications and affect the yield rate. If this ratio is too high, sensitivity analysis can help users locate which devices need to improve accuracy. For example, a 10% precision device can be replaced with a 1% precision device to improve yield, or conversely, if some devices are not critical, users can use 20% precision devices instead of 10% precision devices to reduce costs.
Parametric Plotter
After the circuit is created, multiple parameters can be scanned simultaneously using a parametric plotter. It also provides an effective means to analyze scan results, scan any number and combination of model parameters, and then observe the scan results.
Success Cases

